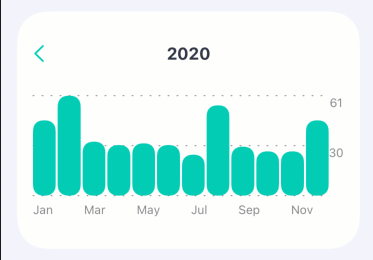
Growrilla - Year Chart | Day #80
For example to see if the event that the custom is tracking has been increasing or decreasing during the year.

80th daily writing streak. Can't believe I'm still keeping this up.
Growrilla is on its way to being open for beta-testing soon. Somewhere this upcoming week, I will be providing a TestFlight link for users to test.
Today, I’ve been working on a new chart. This is the year chart. With this chart, you can get counts from each month during a specific year.
It allows customers to see get an overview of the year.
For example to see if the event that the custom is tracking has been increasing or decreasing during the year.
There are more charts and insights that I want to build.
But for the initial we will be keeping it to be:
- Today count
- Month total count
- Year Count
- Total Count
- Current Count Streak
- Highest Count Streak
- Last Seven Days Counts
Then for premium customers, Growrilla will also display:
- Current Days Streak
- Highest Days Streak
- Year Count Overview
- Days between start- and current date.
Stay tuned for TestFlight links this week!